Similarity search allows for exploration of complex, unstructured data sets, but how is this done exactly? At their core, similarity methods quantify how closely two vectors resemble one another, where vectors are numerical representations of data objects such as documents, images, words, audio files, or temporal data known as vector embeddings. By understanding the similarity between vectors, we can understand similarity between the data objects themselves. In this way, similarity measures help to understand relationships, identify patterns, and make informed decisions in surprisingly diverse and powerful applications such as:
- Anomaly Detection: Identifying deviations from normal patterns by measuring the similarity of data points and detecting anomalies
- Clustering and Classification: Clustering similar data points or classifying objects into distinct categories as these tasks require similar points to be grouped together
- Information Retrieval: Using search engines for measuring the similarity between user queries and indexed documents to retrieve the most relevant results
- Recommendation Systems: Finding similar items or products and enabling recommendation systems to suggest items based on user preferences
Commonly Used Similarity Measures Explained
The similarity measure you choose will depend on the nature of the data and the specific application at hand. There are three commonly used similarity measures, all with their various strengths and weaknesses. Let’s look at each in turn, then we’ll talk about when to use them.
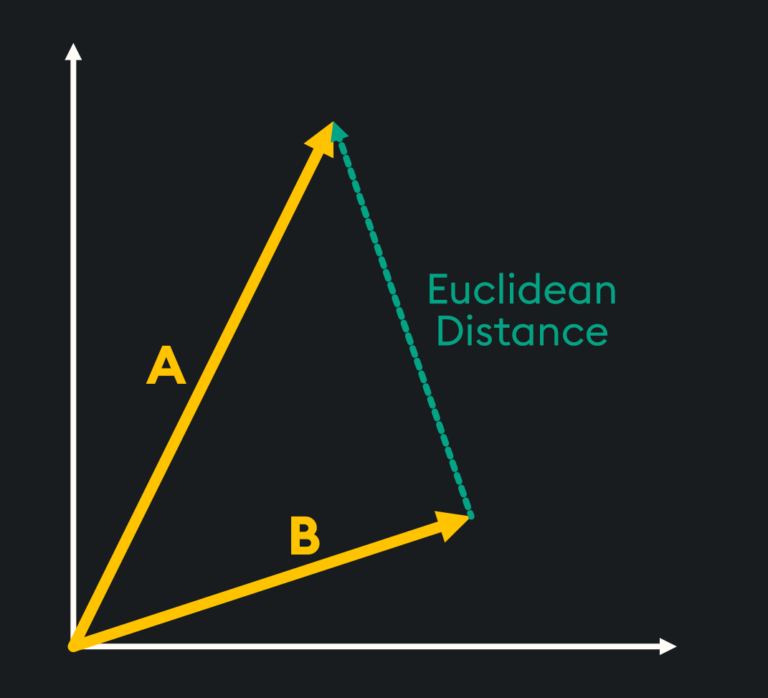
Euclidean Distance
Euclidean distance assesses the similarity of two vectors by measuring the straight-line distance between the two vector points. Vectors that are more similar will have a shorter absolute distance between them, while more dissimilar vectors will have a larger distance between one another.
The mathematical formula for calculating the Euclidean Distance between vectors a and b with n-dimensions is given by:
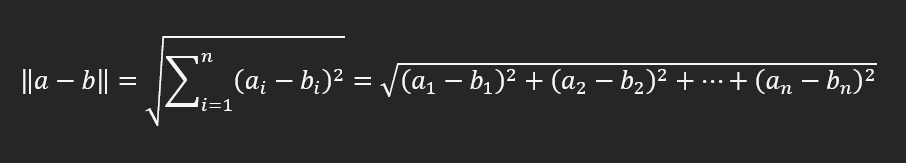
To the mathematicians among you, you will understand that this takes the difference between the corresponding elements in the two vectors, squares the resulting values, sums these squares together, and then provides the square root of this value.
Let’s walk through an example where we’ll define two three-dimensional vectors, A = (4, 5, 6) and B = (1, 2, 3), and run through the calculation steps.
Step 1: Find the difference between the corresponding elements in the two vectors:
- x-coordinate:
4 – 1 = 3 - y-coordinate:
5 – 2 = 3 - z-coordinate:
6 – 3 = 3
Step 2: Square the obtained differences:
- x-coordinate:
3² = 9 - y-coordinate:
3² = 9 - z-coordinate:
3² = 9
Step 3: Add these squared differences together:
9 + 9 + 9 = 27
Step 4: Get the square root of this summed value:
√27≈5.196
When calculating Euclidean Distance in spaces higher than 2- or 3- dimensions, it’s often referred to as the “L2-norm.” This is why when specifying Euclidean Distance as your similarity measure in KDB.AI, you will use “L2” as the metric parameter. L2-norm is just a generalization of Euclidean Distance in higher dimensional space.
One key feature about the way Euclidean Distance is calculated is that it takes the magnitude of the vectors and the relative direction of the vectors into account. This gives a comprehensive measure of the separation and alignment of the two points in space. However, as magnitude is important, this may yield surprising results in cases where the magnitude of the vectors varies across a dataset:
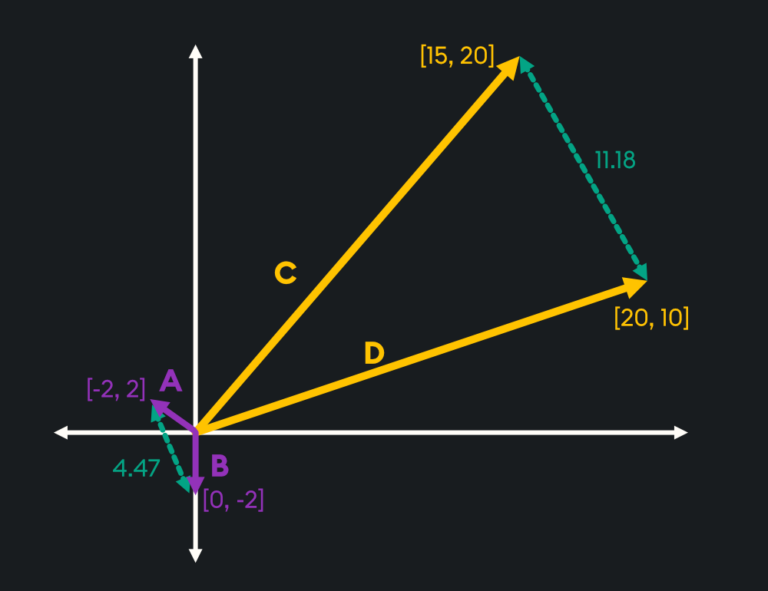
As you can see from the above image, vectors C and D point in the same direction, which may initially lead you to believe they are more similar than vectors A and B. However, as Euclidean distance is calculated through the straight-line distance between the vectors, the fact A and B are smaller vectors means they are deemed more similar when using this measure.
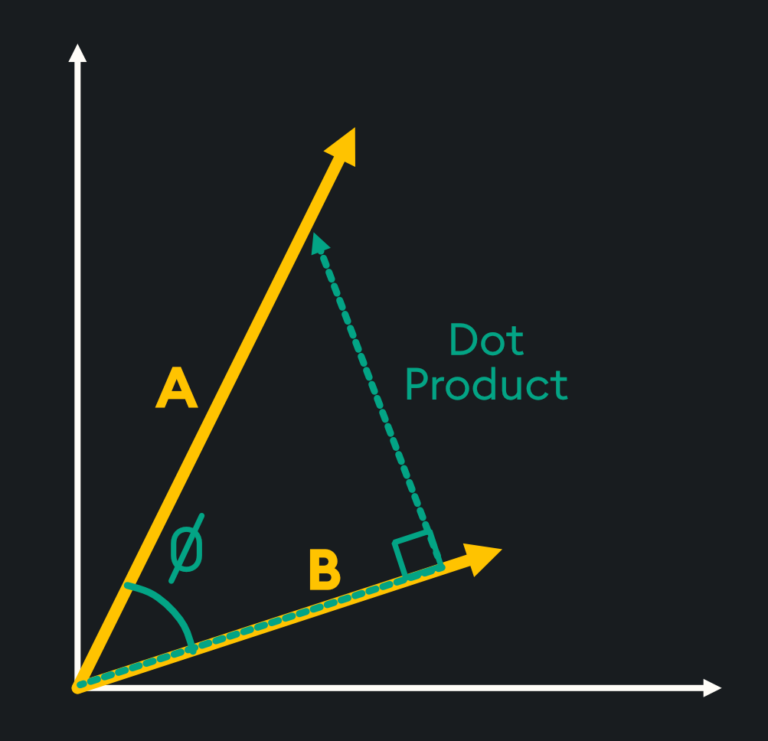
Dot Product
The dot product is a simple measure used to see how aligned two vectors are with one another. It tells us if the vectors point in the same direction, opposite directions, or are perpendicular to each other. It is calculated by multiplying the corresponding elements of the vectors and adding up the results to get a single scalar number.
For vectors a and b with n-dimensions, the dot product is defined mathematically as:
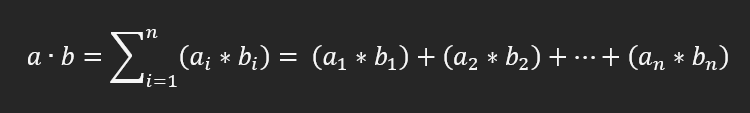
This simple equation multiplies the corresponding elements of the vectors and sums these resulting products together. To give an example of this, if we had two vectors: A = (1, 2, 3) and B = (4, 5, 6), the dot product would be calculated as follows:
Step 1: Multiply the corresponding elements in the two vectors
- x-coordinate:
1 * 4 = 4 - y-coordinate:
2 * 5 = 10 - z-coordinate:
3 * 6 = 18
Step 2: Add these results together
4 + 10 + 18 = 32
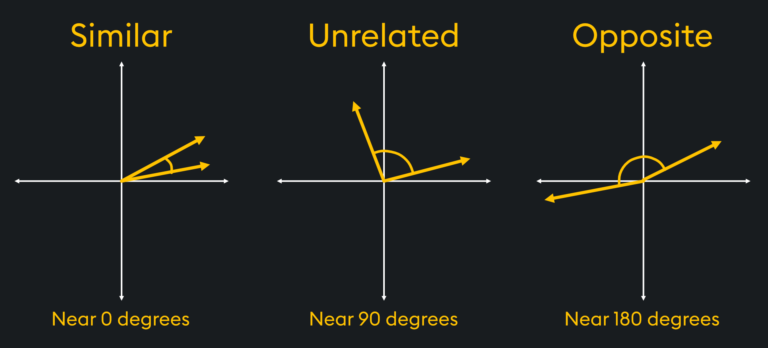
If the result is large and positive, it means the vectors have similar directions, while if the result is large and negative, it means the vectors have opposite directions. When the dot product is zero, it means the vectors are perpendicular, forming a 90-degree angle.
It is common in similarity calculations for vector search to not use exactly 0°, 90°, or 180° to determine similar, unrelated, or opposite vectors respectively. This is because it can exhaust computing resources looking for exact matches between vectors, rather than approximate ones:
Cosine Similarity
Cosine similarity measures the similarity of two vectors by using the angle between these two vectors. The magnitude of the vectors themselves does not matter and only the angle is considered in this calculation, so if one vector contains small values and the other contains large values, this will not affect the resulting similarity value.
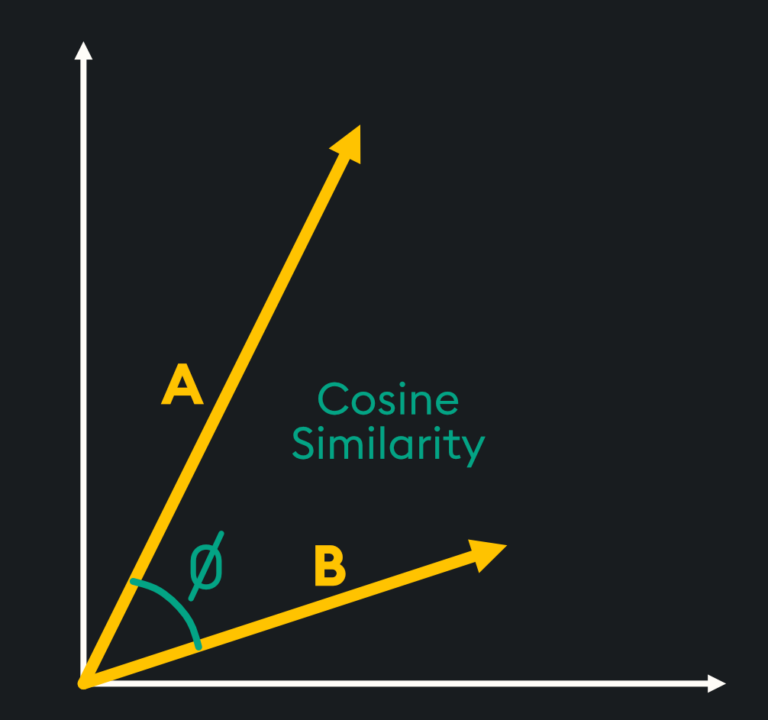
Think of it this way. Euclidean distance is the “as-the-crow-flies” measure between two points while cosine similarity is the idea that similar vectors will likely point in the same direction so the angle between them will be reduced.
For vectors a and b with n-dimensions, cosine similarity is defined mathematically as:
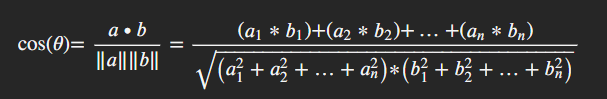
You may notice that the formula for the “dot product” similarity measure is the top part of this equation. This is because the dot product measures the alignment of the vectors’ directions and then the bottom part of the equation normalizes this value by accounting for the magnitude differences in the vectors. This gives us a similarity value between –1 and 1. We can walk through exactly what is going on here using the same two three-dimensional vectors, A = (1, 2, 3) and B = (4, 5, 6), as we used in the dot product example:
Top of Equation
Step 1: Multiply the corresponding elements in the two vectors:
- x-coordinate:
4 * 1 = 4 - y-coordinate:
5 * 2 = 10 - z-coordinate:
6 * 3 = 18
Step 2: Add these results together:
4 + 10 + 18 = 32
Bottom of Equation
Step 3: Square each element in each vector:
- Vector 1:
(1², 2², 3²) = (1, 4, 9) - Vector 2:
(4², 5², 6²) = (16, 25, 36)
Step 4: Add the resulting squared values together:
- Vector 1:
1 + 4 + 9 = 14 - Vector 2:
16 + 25 + 36 = 77
Step 5: Multiply these results together and get the square root of this value:
sqrt(14 x 77) = sqrt(1078) = 32.83
Full Equation
Step 6: Divide the top value by the bottom value:
32/32.83 = 0.9747
As mentioned, cosine similarity only focuses on the direction of the vectors and not on their magnitude, so only the angle between the vectors is considered. This means that vectors will be deemed least similar if they point directly in the opposite direction (180°) and vectors will be deemed most similar if they point in the exact same direction (0°). The cosine of these angles always gives a resulting value ranging between -1 to 1, with a higher value meaning the vectors are more similar.
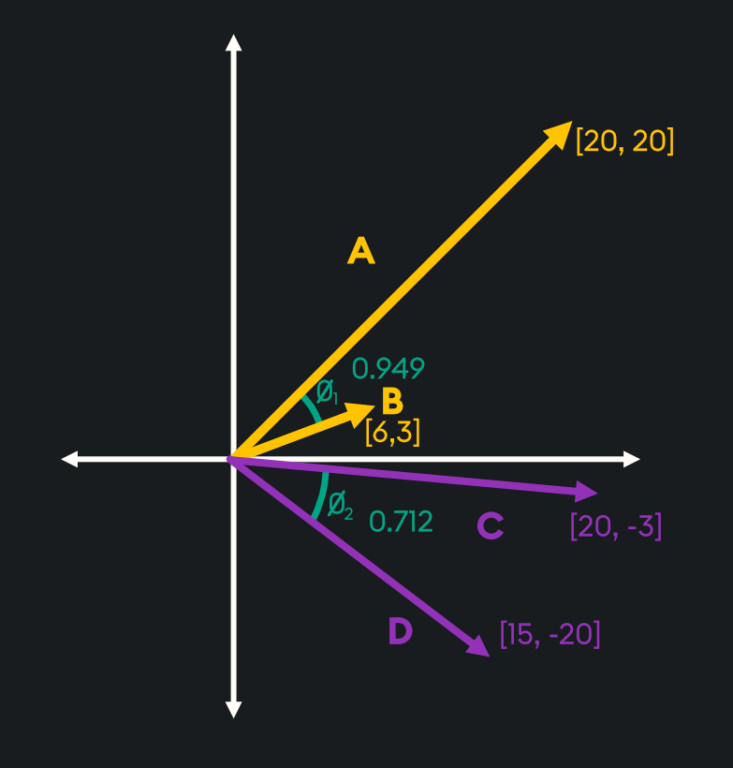
As you can see from the picture above, vectors A and B are deemed more similar when using cosine similarity than vectors C and D as the angle between them is smaller despite the magnitude of these vectors being very different.
When to Use Each Measure
It’s a general best practice to use the same similarity measure for search that the embeddings were trained on; however, the choice of similarity measure also depends on the specific characteristics of the data and the context of the problem you are trying to solve. Here are some top applications for each of the discussed similarity measures:
Euclidean Distance
- Clustering Analysis: Clustering, like k-means, groups data points based on their proximity in vector space.
- Anomaly and Fraud Detection: In these use cases, unusual data points can be detected through unusually large distances from the centroid of normal transactions.
Dot Product
- Image Retrieval and Matching: Images with similar visual content will have closely aligned vectors, resulting in higher dot product values. This makes dot product a good choice when you want to find images similar to a given query image.
- Neural Networks and Deep Learning: In neural networks, fully connected layers use the dot product to combine input features with learnable weights. This captures relationships between features and is helpful for tasks like classification and regression.
- Music Recommendation: Dot product similarity helps identify tracks with similar audio characteristics, making it valuable for music recommendation systems.
Cosine Similarity
- Topic Modeling: In document embeddings, each dimension can represent a word’s frequency or TF-IDF weight. However, two documents of different lengths can have drastically different word frequencies yet the same word distribution. Since this places them in similar directions in vector space but not similar distances, cosine similarity is a great choice.
- Document Similarity: Another application of Topic Modeling. Similar document embeddings have similar direction but can have different distances.
- Collaborative Filtering: This approach in recommendation systems uses the collective preferences and behaviors of users (or items) to make personalized recommendations. Users (or items) are represented as vectors based on their interactions. Since overall ratings and popularity can create different distances, but the direction of similar vectors remains close, cosine similarity is often used.
The Brains of Vector Databases
Vector similarity is the fundamental reason vector databases work so well. By understanding the different similarity measures and their appropriate use cases, we can make informed decisions and extract valuable insights from complex datasets. Whether it’s for information retrieval, recommendation systems, or clustering, these measures form the foundation of unstructured data search.